Time analysis of different library methods
2020 · Kusha Sahu
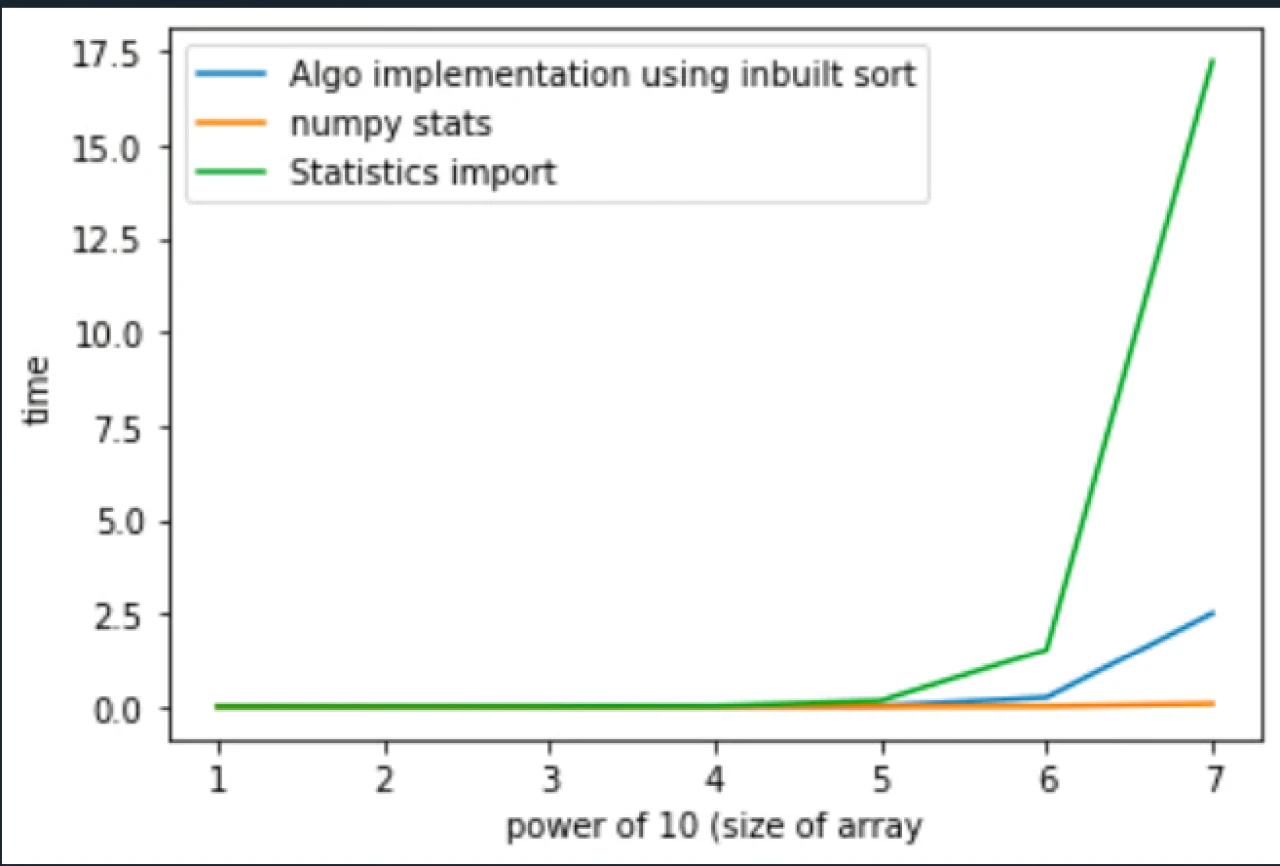
While implementing the simple solutions, I wondered how to optimise the solutions using different library functions. Here I timed 3 approaches to calculating mean and medians of 1D arrays and how different library functions react to the different sizes of the array.
The three approaches are: 1. Naive calculation of mean and approach by implementing the algorithms for both. 2. using numpy mean and median functions. 3. using statistics mean and median functions.
def list_stats_1 (arr) :
    size = len(arr)
    arr.sort()
    mid = math.floor(size/2)
    mean = sum(arr)/size if size > 0 else 0
    median = 0
    if size > 0:
        if size % 2 == 0:
            median = (arr[mid-1]+arr[mid])/2
        else:
            median = arr[mid]
    return np.round(median, 5), np.round(mean, 5)

def list_stats_2 (arr) :
    mean = np.mean(arr)
    median = np.median(arr)
    return np.round(median, 5), np.round(mean, 5)

def list_stats_3 (arr) :
    mean = statistics.mean(arr)
    median = statistics.median(arr)
    return np.round(median, 5), np.round(mean, 5)
I ran the code on array of sizes from 10 to 10^8 having random numbers.